Assessment of molecular soil composition by shifted excitation Raman difference spectroscopy (SERDS)
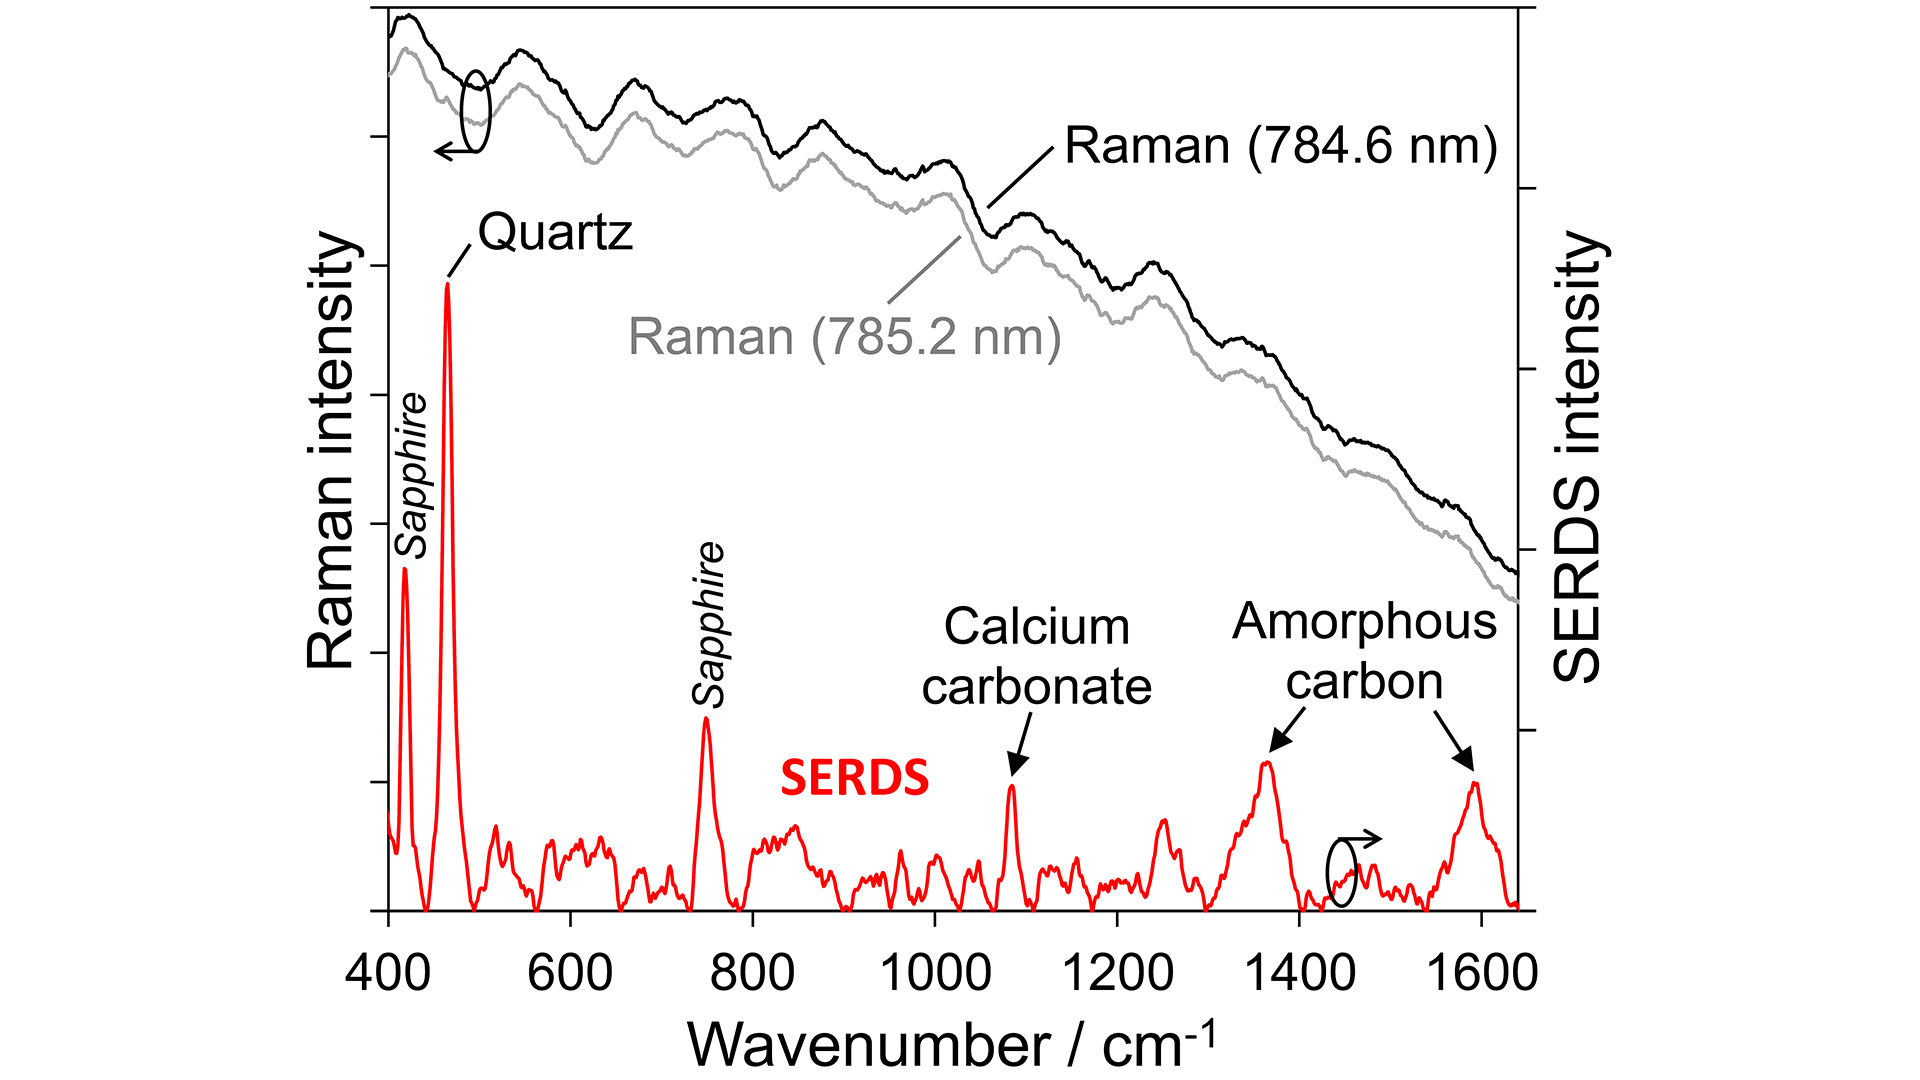
Fig. 1: Average of 100 Raman spectra (top curves) excited at 785.2 nm and 784.6 nm, and SERDS spectrum (bottom curve) obtained from 10 individual measurement positions along a distance of 10 mm of a selected soil sample.
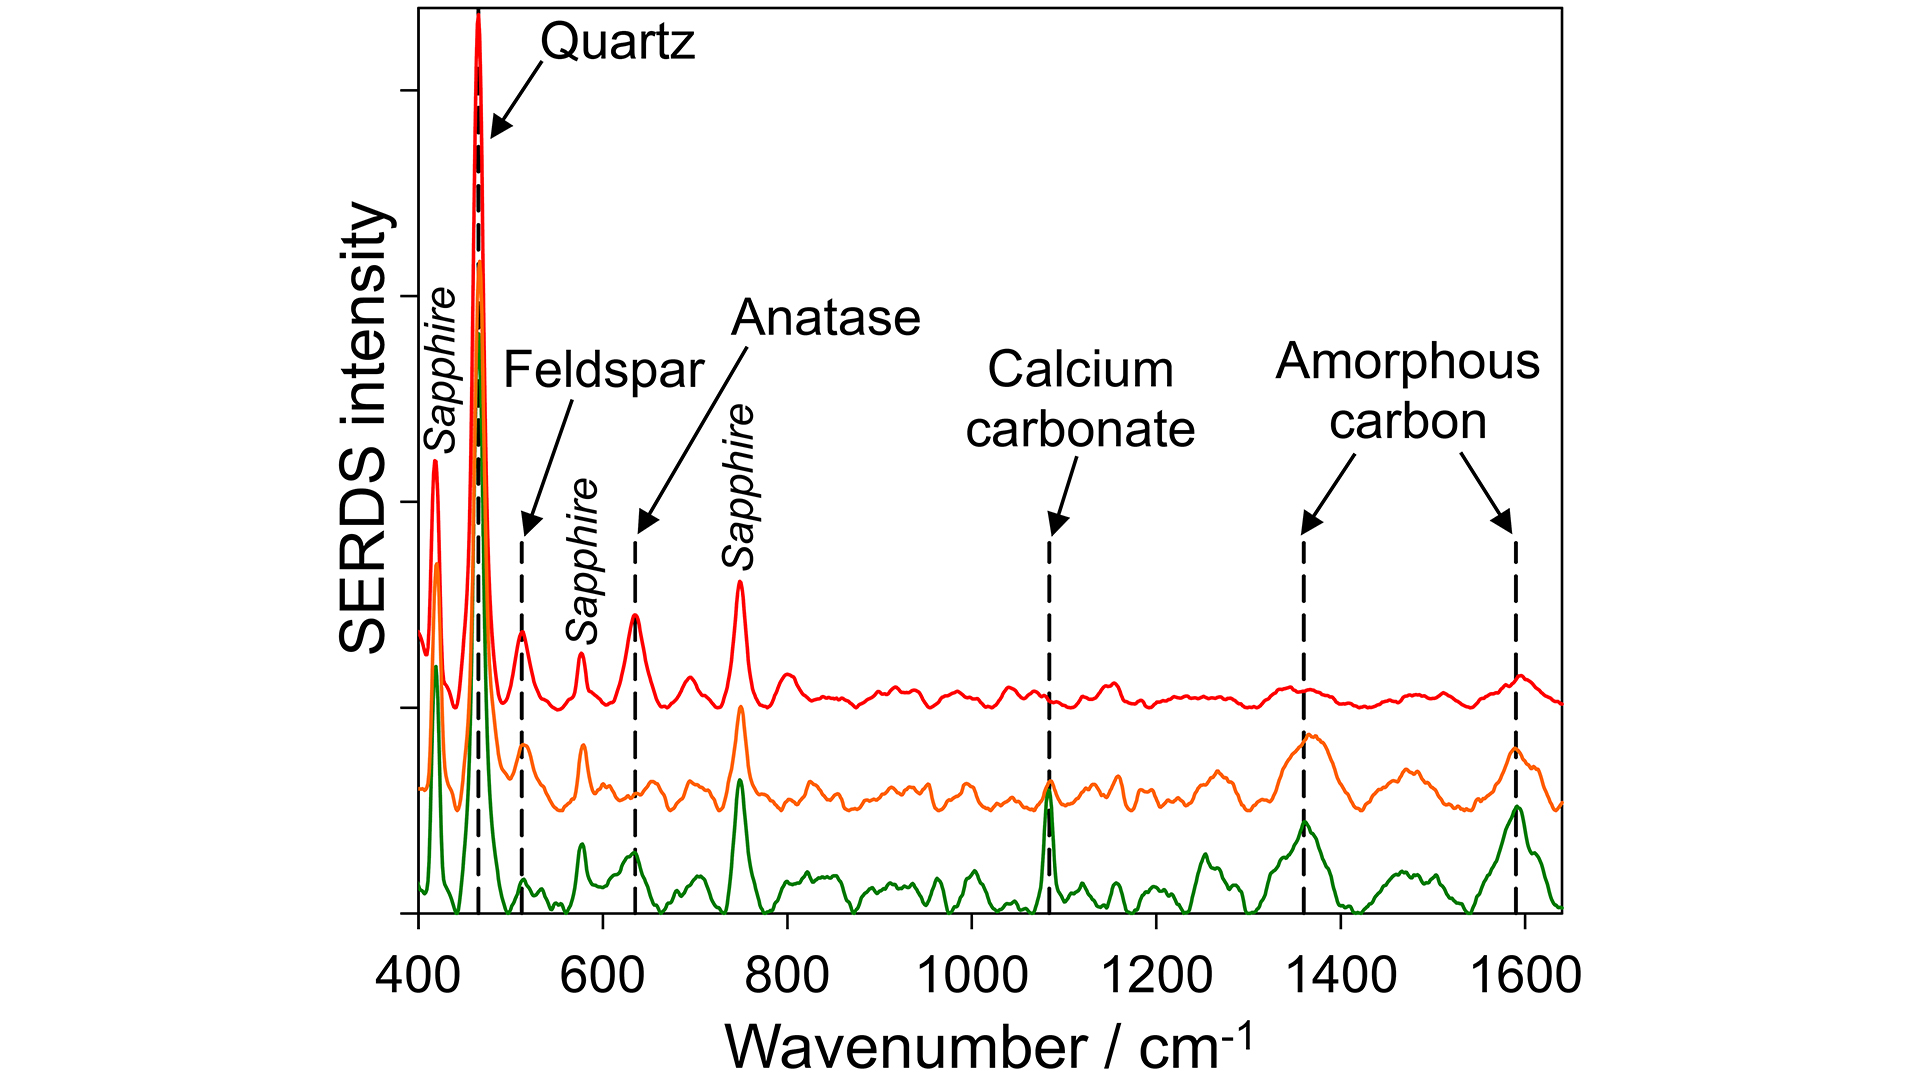
Fig. 2: Representative SERDS spectra of three selected soil samples. Vertical dashed lines indicate Raman signal positions of identified soil constituents. Spectra are vertically offset for clarity.
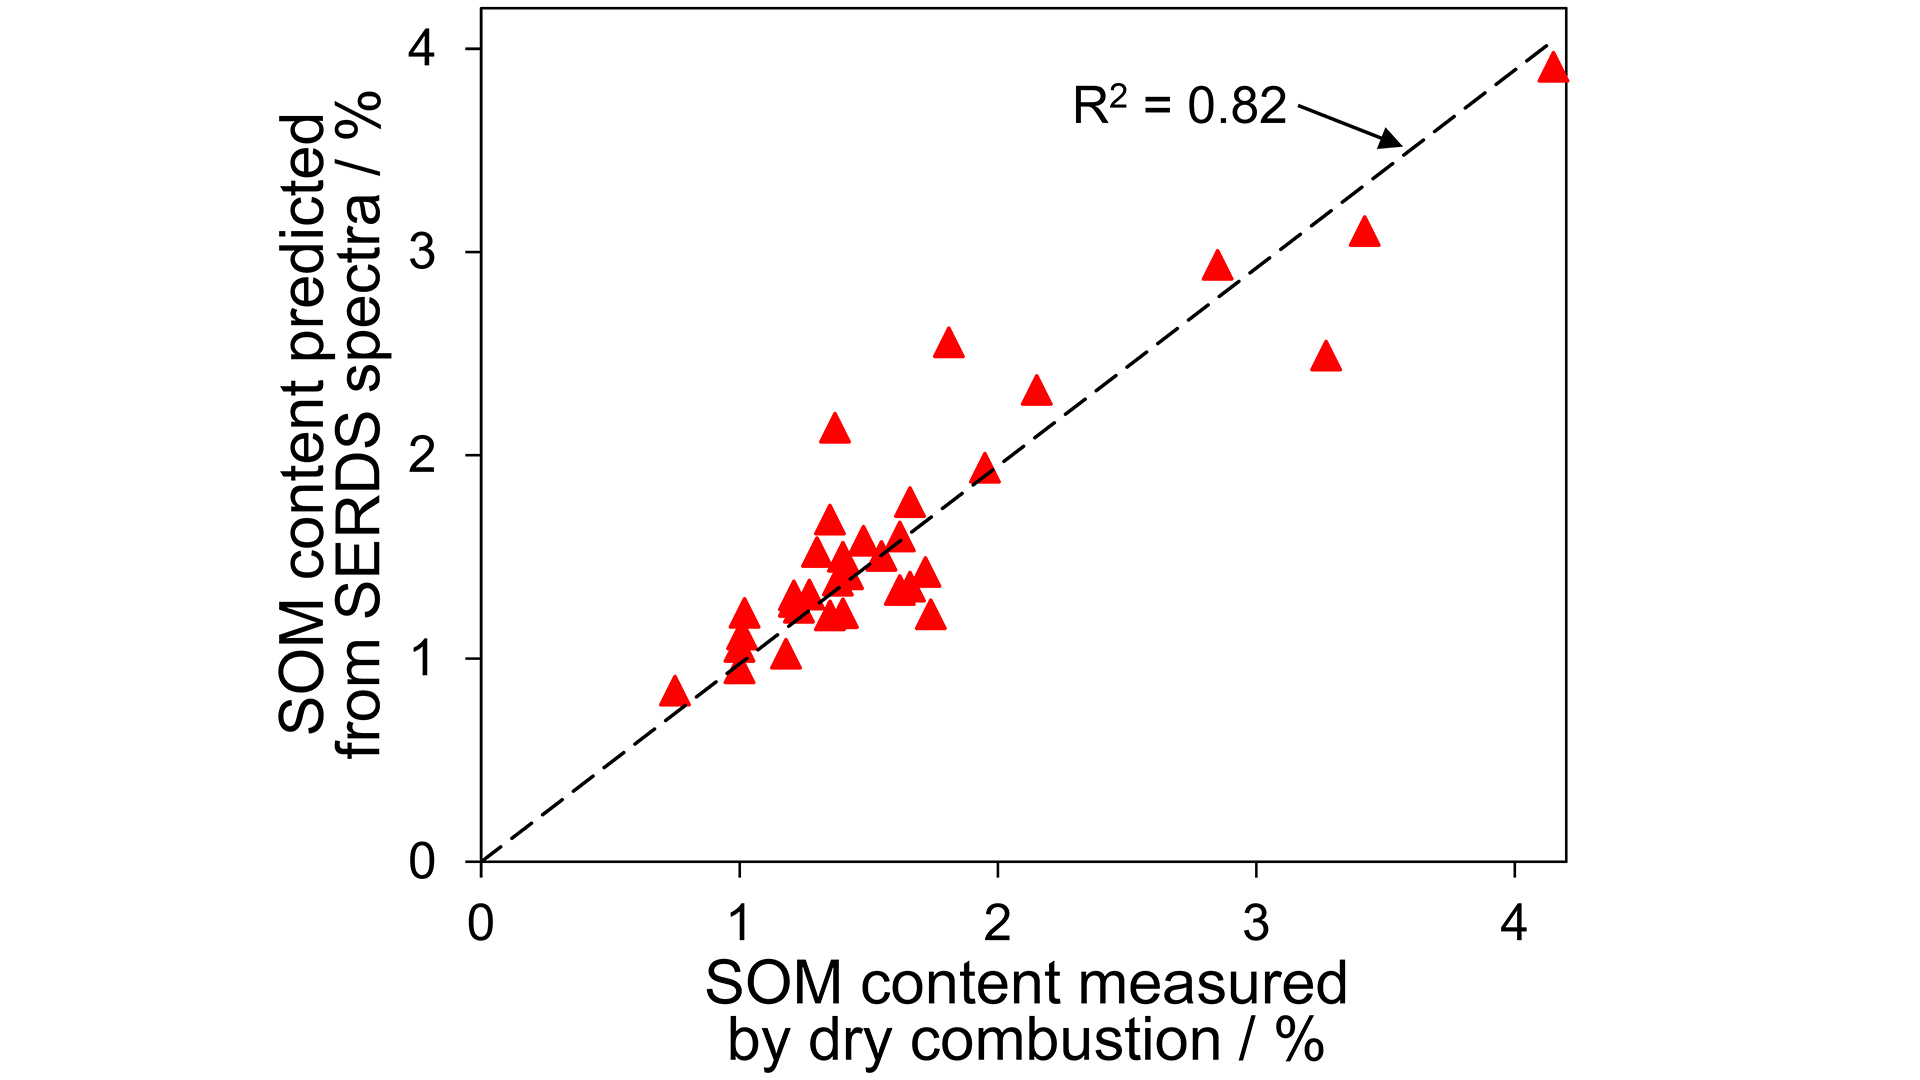
Fig. 3: SOM content predicted from SERDS spectra of 33 soil samples using partial least squares regression plotted in dependence of SOM content measured by laboratory reference analysis.
Precision agriculture and soil nutrient management are of global importance to boost crop productivity, increase soil health and reduce excessive fertilizer usage. In situ sensor techniques can provide the necessary information for on-site decision support systems. Using Raman spectroscopy can help to identify molecules and thus enables qualitative and quantitative sample analysis. This is because the powerful and well-established spectroscopic technique delivers Raman signals in a fingerprint-like spectrum. However, the weak Raman signals are often masked by strong fluorescence background signals and daylight interferences when used outdoors. Our approach to overcome this problem is using shifted excitation Raman difference spectroscopy (SERDS), which efficiently separates Raman signals from such disturbing backgrounds. SERDS utilizes a physical approach with two slightly shifted laser wavelengths and is carried out here with customized, in-house developed dual-wavelength diode lasers.
This is illustrated in Fig. 1 (top) where the Raman spectra excited at 785.2 and 784.6 nm using a laboratory setup are almost entirely masked by strong fluorescence background signals and Raman signals of soil constituents are not visible. In contrast, the SERDS spectrum in Fig. 1 (bottom) enables to identify several characteristic Raman bands. Besides signals originating from the sapphire window used in our measurement setup at 418 cm-1 and 750 cm-1, Raman signals of soil constituents can be identified. These include the minerals quartz at 465 cm-1 and calcium carbonate at 1083 cm-1 as well as amorphous carbon at 1360 cm-1 and 1590 cm-1.
Based on initial pilot investigations on soil [1], we now present a systematic SERDS laboratory study on 33 soil samples collected from an agricultural field in northeast Germany (52.39N; 14.46E). Representative SERDS spectra recorded on three selected soil samples are displayed in Fig. 2 as an example. Apart from three Raman signals originating from the sapphire window, characteristic signals of various soil constituents can be identified. Beside the minerals quartz, calcium carbonate, feldspar (at 512 cm-1) and the titanium dioxide form anatase (at 634 cm-1), also amorphous carbon could be identified. As expected, the Raman signals of the mentioned soil components show pronounced intensity differences between the three soil samples due to the inherent soil heterogeneity.
Soil organic matter (SOM) content is an important parameter influencing the overall soil condition, including fertility, nutrient cycling, and structure. Laboratory dry combustion analysis is an established method for SOM content determination. Using these reference values, we applied partial least squares regression to predict SOM content based on the SERDS spectra. A plot of the SOM contents predicted from the SERDS data in dependence of the SOM contents determined by reference analysis is displayed in Fig. 3. In this way, a linear correlation between predicted and measured SOM content with a very good coefficient of determination of R2 = 0.82 is demonstrated.
Overall, the obtained results highlight the suitability of SERDS for qualitative (identification of soil constituents) and quantitative (e.g. prediction of SOM content) soil analysis [2]. SERDS could thus become a powerful tool for soil analysis in the context of precision agriculture opening up new avenues towards efficient soil nutrient management. With this goal in mind, recently an on-site pilot experiment using an in-house developed portable SERDS measurement system was successfully conducted [3].
The work was funded by the Federal Ministry of Education and Research (BMBF) in the project RaMBo (Raman-Messsystem zur ortsspezifischen Bodenanalytik) within the consortium I4S in the frame of the funding measure BonaRes (Soil as a Sustainable Resource for the Bioeconomy) under grant numbers 031A564C and 031B0513C.
Publications:
[1] L. S. Theurer, M. Maiwald, B. Sumpf, “Shifted excitation Raman difference spectroscopy: A promising tool for the investigation of soil”, European Journal of Soil Science, vol. 72, no. 1, pp. 120-124 (2021).
[2] K. Sowoidnich, S. Vogel, M. Maiwald, B. Sumpf, “Determination of soil constituents using shifted excitation Raman difference spectroscopy”, Applied Spectroscopy, vol. 76, no. 6, pp. 712-722 (2022).
[3] M. Maiwald, K. Sowoidnich, B. Sumpf, "Portable shifted excitation Raman difference spectroscopy for on-site soil analysis", Journal of Raman Spectroscopy, doi: 10.1002/jrs.6400 (2022).