Advanced chemometrics for accurate classification of spectroscopic data
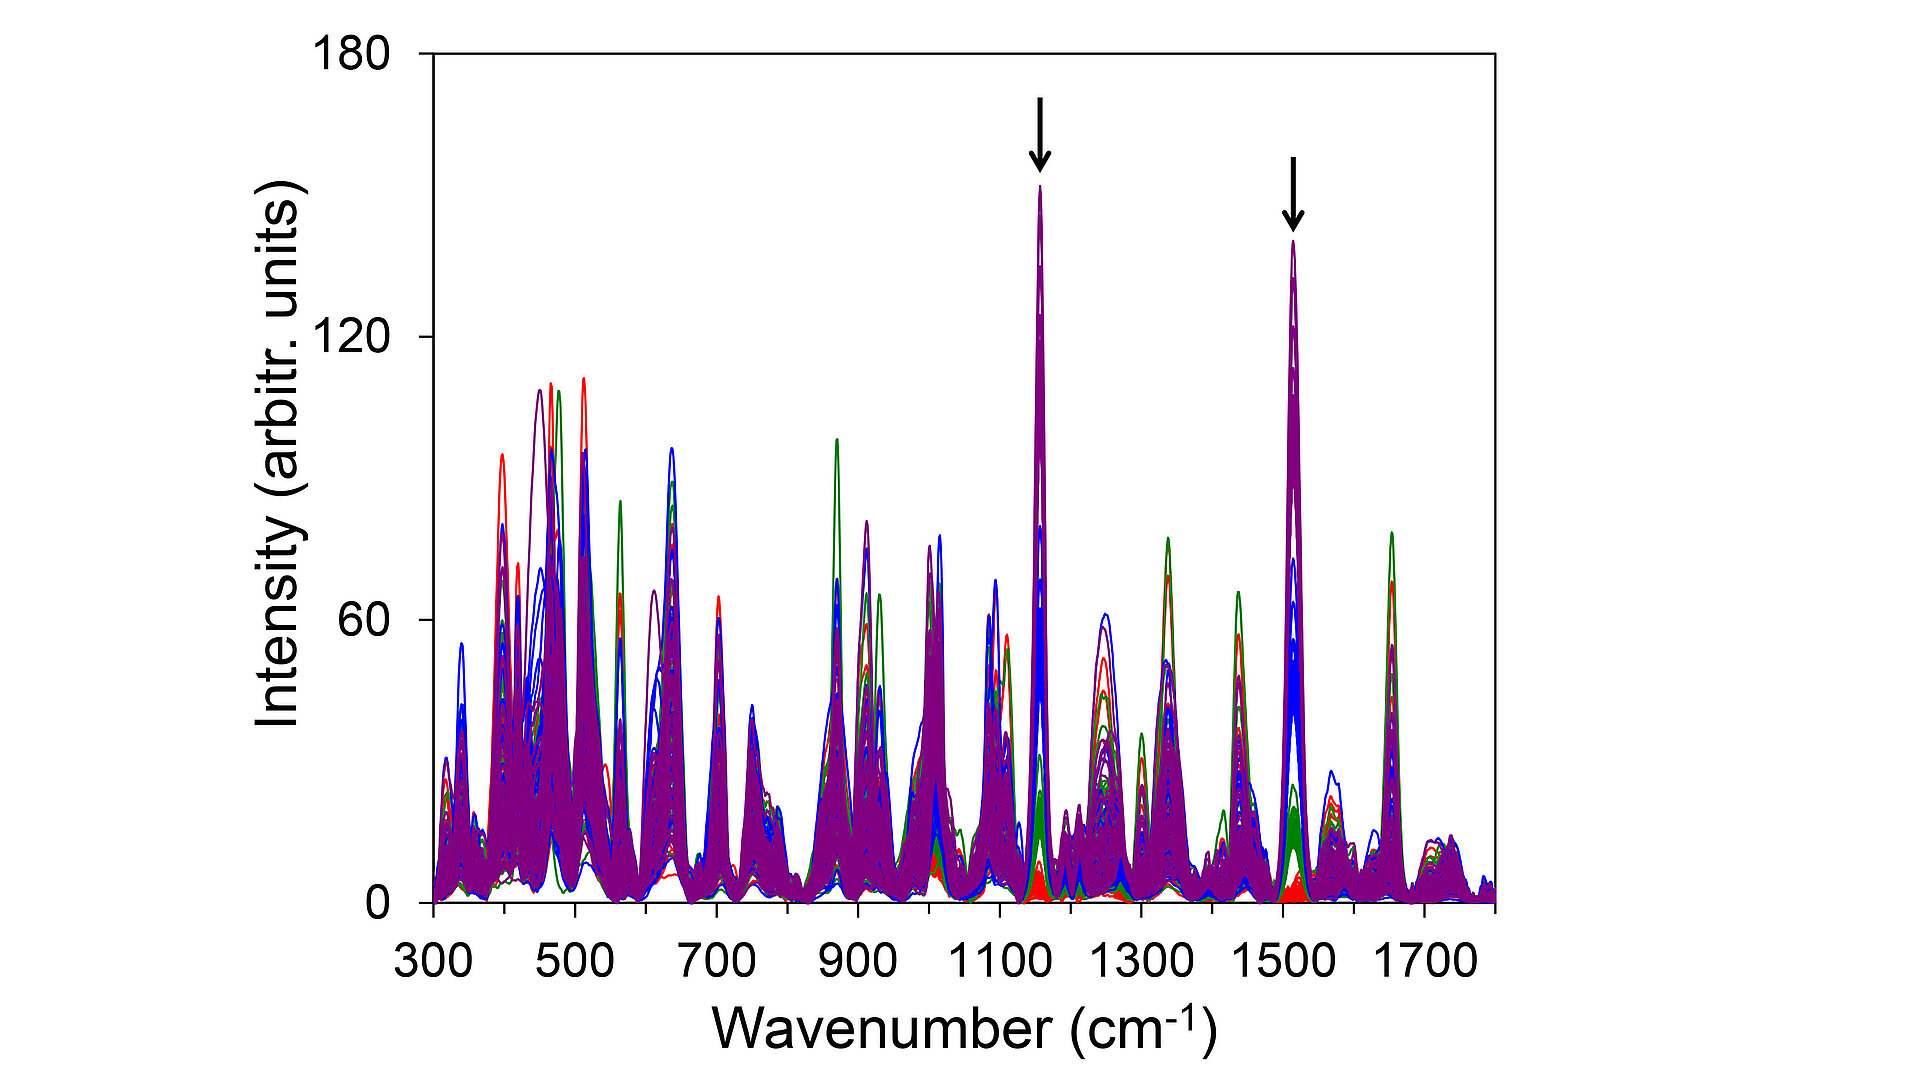
Fig. 1: Plot of randomly chosen Raman spectra containing 50 spectra from each of the four classes. Line colors represent individual classes: red (class 0), green (class 1), blue (class 2), and purple (class 3). Arrows indicate two strongest Raman signals of the target substance beta-carotene.
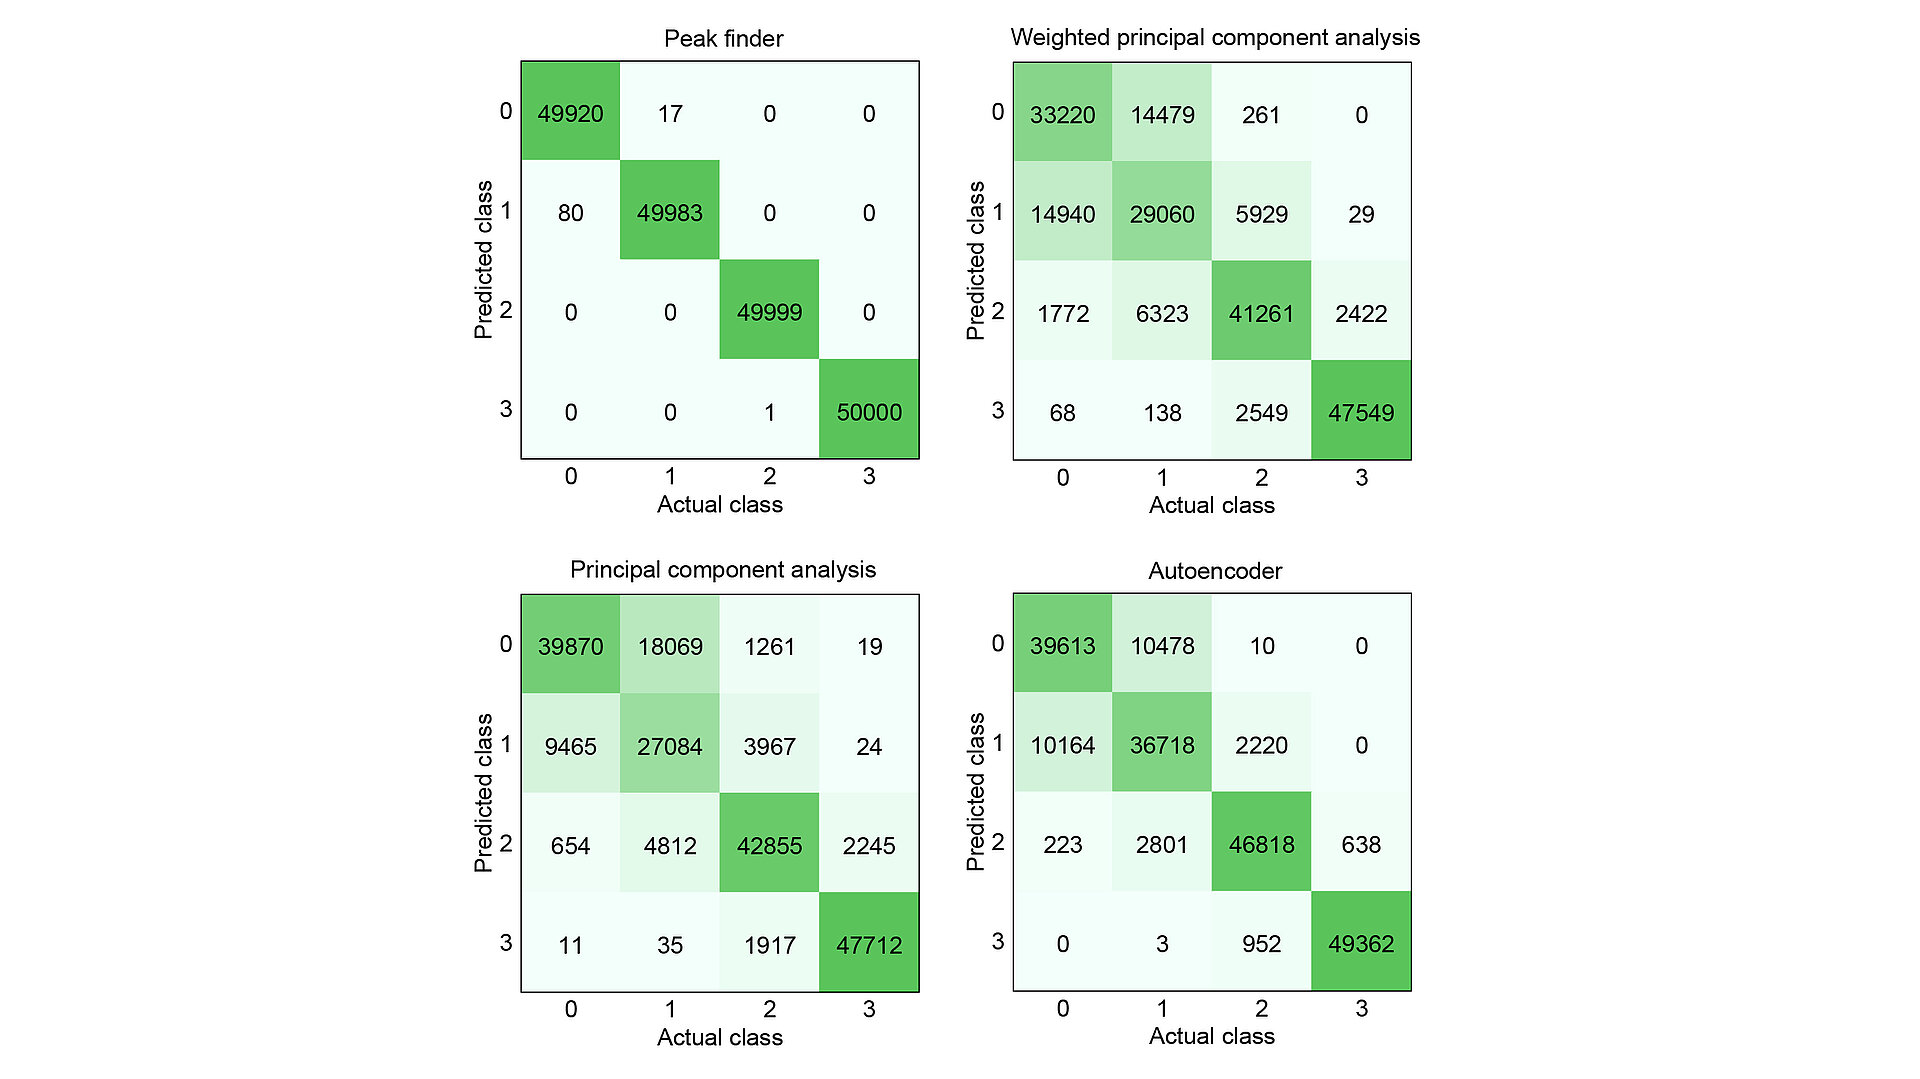
Fig. 2: Confusion matrices for Raman spectroscopic data set evaluated by different methods for feature selection prior to classification. Labels represent distinct concentration classes of beta-carotene: absent (class 0), or present at low (class 1), medium (class 2), or high (class 3) concentration.
Efficient data analysis is essential for evaluating high-dimensional spectroscopic data. A key step is the identification of suitable methods for data reduction to enable accurate qualitative and quantitative analysis. This includes, e.g., the precise classification of data into distinct concentration classes of relevant target substances. Current challenges in data reduction arise from high data complexity resulting in long algorithm runtimes, poor classification accuracy, and low interpretability of identified features.
To address these issues, we developed an advanced approach for the accurate classification of spectroscopic data sets in close collaboration with the Lausitz Center for Artificial Intelligence (LZKI) at BTU Cottbus-Senftenberg. Spectra are frequently acquired using multi-channel detectors, such as charge-coupled devices (CCDs). They are composed of intensity values measured at many different wavelengths (pixels on the CCD), i.e., they contain on the order of 1000 different features. To evaluate our method, we created exemplarily sets of vibrational spectra as training data aiming for quantitative analysis. Each data set, containing at least 100,000 spectra, includes four distinct ranges of signal intensities of a specific target substance (beta-carotene for Raman data and water vapor for absorption data). They represent the absence (class 0) or the presence of the target substance at low (class 1), medium (class 2), and high (class 3) concentrations. As illustrated for the Raman spectra in Fig. 1, the target substance is contained in a matrix of several other randomly selected substances, mimicking a complex mixture of different components.
The novel peak finder algorithm uses principal component analysis (PCA) in an innovative way, namely for feature selection rather than feature transformation. Instead of considering the entire spectroscopic information at all pixels, it identifies wavelengths that show the most pronounced changes. Only this small subset of relevant features is then used as input for classifying the data set into the four distinct concentration classes. A conventional decision tree is applied to retain the interpretability of the final classification.
To assess the performance of the peak finder approach, we compared it with three frequently applied state-of-the-art methods for feature reduction: autoencoder, PCA, and weighted PCA (WPCA). The corresponding confusion matrices, which relate actual class membership to predicted class assignment, are shown in Fig. 2. Using the peak finder, the number of incorrectly classified samples – particularly between adjacent classes – is significantly reduced compared to the other methods. Overall, the fraction of correctly classified samples is 99.9 % for the peak finder, compared to 86.3 % for the autoencoder, 78.8 % for PCA, and 75.6 % for WPCA.
These results demonstrate the large potential of the developed feature selection approach for the classification of high-dimensional spectroscopic data. As no prior knowledge about the target substance spectrum is required, the peak finder is well suited for automated data evaluation in multi-component mixtures and shows strong potential for transfer to other spectroscopic techniques.
This work was supported by the Federal Ministry of Research, Technology and Space (BMFTR) within the projects iCampus (Grant Nos. 16ES1132 and 16ME0425), OASYS (Grant No. 16ME0871), and Research Fab Microelectronics Germany (FMD) framework (16FMD02).
Publication
I. Schmitt, K. Sowoidnich, T. Gosswami, B. Sumpf, M. Maiwald, M. Wolff, “PCA-Based Peak Feature Selection for Classification of Spectroscopic Datasets”, Journal of Chemometrics, 39, e70074 (2025).