From convoluted data to interpretable results: exploring LLM-assisted statistical analysis
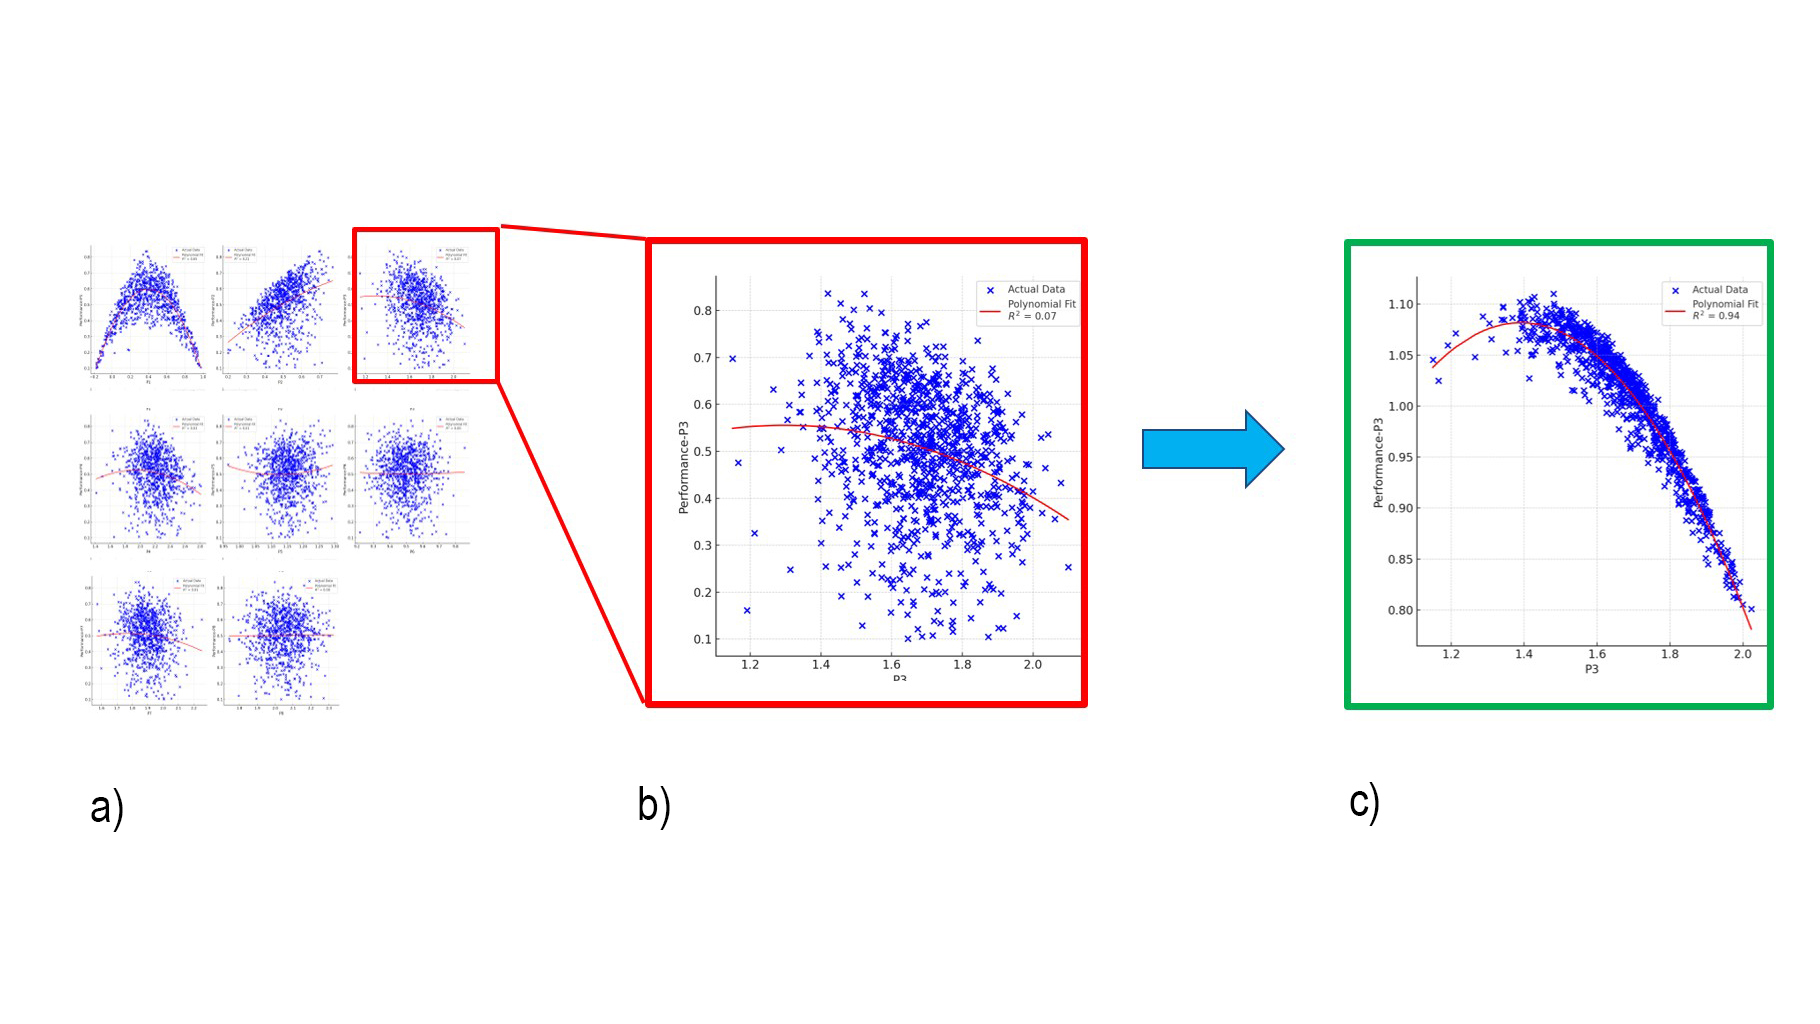
Fig. 1: LLM-guided deconvolution reveals hidden parameter effects: weak raw correlations (a, b) are resolved into clear trends (c) through iterative regression.
Modern R&D and industrial environments are saturated with data. Thanks to automated systems and networked sensors, virtually every aspect of production and experimentation can be recorded. However, this abundance comes at a cost: data is often highly heterogeneous and convoluted, with interdependent effects entangled in ways that make individual contributions hard to discern. In such scenarios, performance metrics (e.g., device yield or efficiency) depend on a complex interplay of parameters, often obscured by noise and correlation. While these datasets may initially appear statistically weak, we posit that they hold untapped potential for performance optimization – if interpretable signals can be extracted. This process, however, typically demands advanced process understanding and significant manual effort, making it a bottleneck in data-driven optimization.
To address this challenge, we explored whether a Large Language Model (LLM), specifically ChatGPT, could assist in untangling such complex data. Our test case involved a synthetic dataset of 1,000 devices influenced by eight independent parameters. Each parameter was designed to have a parabolic relationship with performance – i.e. an optimum at a central value, with quadratic degradation away from it. The combined effects were multiplicative, resulting in a highly convoluted dataset. We prompted ChatGPT to iteratively deconvolve the data via nonlinear regression, isolating the contribution of each parameter. This approach consisted of repeatedly fitting regression curves to subsets of the data, thereby estimating individual parameter impacts.
Using only text-based prompts, the LLM effectively recovered the underlying influence of each parameter. The reconstructed parameter effects closely aligned with the known weights used to generate the dataset. Fig. 1 illustrates this process:
- a) shows the raw, entangled data: each subplot plots device performance against one parameter. The visible relationships are weak and noisy due to convolution with all remaining parameters,
- b) zooms in on one such relationship (parameter P3), showing a low explanatory power (R² = 0.07) for a direct regression,
- c) shows the deconvolved view after isolating other parameter effects. The underlying parabolic trend becomes clearly visible, with a much stronger fit (R² = 0.94).
While our method does not introduce new statistical techniques, it demonstrates that LLMs – guided by simple, structured prompts – can automate repetitive, expertise-heavy tasks like curve fitting and parameter isolation. Embedding these capabilities into R&D and production workflows promises faster turnaround, greater reproducibility, and broader access to interpretable insights from complex datasets.